

According to the latest statistics released by CTS, global container throughput reached 192.9 million TEU in 2025, representing a 4.7% increase from 184.3 million TEU in 2024 and setting a new historical record. During the year, eight months recorded monthly volumes exceeding 16 million TEU, with March, May, August, and December each reaching new monthly peaks.
Despite the continued growth in cargo volumes, freight rates did not rise accordingly. By the end of 2025, overall freight rates had declined by nearly 20% year-on-year. CTS noted that the price formation mechanism traditionally driven by supply-demand fundamentals may be undergoing structural changes, with the positive correlation between cargo growth and rate increases gradually weakening.
Judah Levine, analyst at Freightos, observed that although global shipping demand remains on an expansion trajectory, liner companies have not seen proportional revenue support, suggesting that the industry may be entering a new cycle. Market uncertainty remains significant. While demand is widely expected to continue growing in 2026, leading carriers such as Maersk project earnings ranging from profit to a potential loss of up to USD 1 billion. The key variable lies in whether Red Sea shipping routes return to normal operations. Continued diversions would further affect cost structures and capacity deployment.
Regionally, East Asia remains the world’s primary export hub. In 2025, container exports from East Asia increased by nearly 7 million TEU year-on-year, contributing substantially to global growth. This performance is particularly notable given earlier concerns about a slowdown in trans-Pacific trade amid global economic uncertainty.
In terms of trade structure, intra-Asia trade became the largest route segment in 2025, growing 5% year-on-year and reaching more than double the volume of the second-largest route, East Asia–North America. This reflects deepening regional supply chain integration. Meanwhile, European import demand showed strong growth, rising 9% year-on-year—primarily driven by shipments from East Asia—with monthly volumes peaking at 1.8 million TEU, underscoring Europe’s continued reliance on Asian manufactured goods.
By contrast, North America was the only major region to record an overall import decline, down 2% year-on-year. Contributing factors included reduced exports from East Asia and stagnant exports from Europe, along with shifts in consumption patterns, inventory cycles, and trade policy uncertainty.
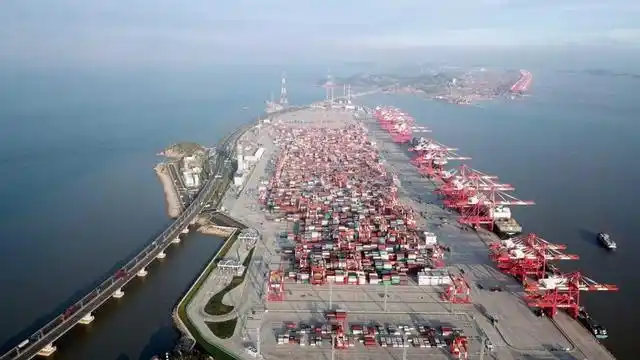
As global volumes hit record highs, port system capacity became a critical stabilizing factor in the global supply chain. The world’s top five container ports in 2025 remained as follows:
First, Port of Shanghai, the world’s largest container port, handling over 40 million TEU annually and serving as a core hub supported by the Yangtze River Delta manufacturing base.
Second, Port of Singapore, a key global transshipment hub strategically located along major East–West trade lanes, known for advanced automation and digital port operations.
Third, Port of Ningbo-Zhoushan, leveraging eastern China’s industrial clusters and ranking among the world’s leaders in comprehensive throughput.
Fourth, Port of Shenzhen, a core gateway within the Greater Bay Area, specializing in high-value exports such as electronics.
Fifth, Port of Qingdao, playing a significant role in Northeast Asian shipping networks and advancing smart port development.
The concentration of leading ports in East Asia aligns with the region’s strong export performance. Continued enhancement of port infrastructure has helped mitigate disruptions from Red Sea diversions and geopolitical tensions, maintaining relative stability in global logistics networks.